In Brief
Pausing writing to generate and inject charts on demand produces reports with much tighter chart–text alignment and deeper, decision-focused insights than pipelines that precompute or append charts.
ON THIS PAGE
Key Findings
Generating visual evidence during drafting — by letting a writing agent request charts from a data-focused analysis agent and then conditioning the next sentences on those charts — leads to clearer, better-grounded claims. The two-agent setup interleaving approach separates data analysis (chart creation and captions) from long-form drafting, allowing the narrative to evolve around real, freshly built evidence. Across multiple real-world report sources and human plus automated judges, this interleaving approach ranked best on average for chart quality, text–chart consistency, and information depth.
By the Numbers
1Tested on 60 reports (20 from each of three sources: Tableau Public, Our World in Data, USAFacts), covering 18 topics.
2Dataset overview used 5–8 exploratory checks per dataset to give the analysis agent enough context before on-demand visualization.
3Evaluation used six criteria at three levels (chart, chapter, report); EvidFuse ranked best on average by both an automated LLM judge and human evaluators in most cases.
Why It Matters
Product teams building automated reporting or business intelligence workflows will get more reliable narratives and charts by adopting write-time chart construction. Engineers designing agent pipelines can use the two-agent pattern to avoid frozen evidence and produce decision-ready insights. Researchers comparing report-generation methods should consider interleaving evidence as a practical alternative to text-first or graph-first pipelines. two-agent pattern can guide teams in adopting this approach.
Not sure where to start?Get personalized recommendations
Key Figures
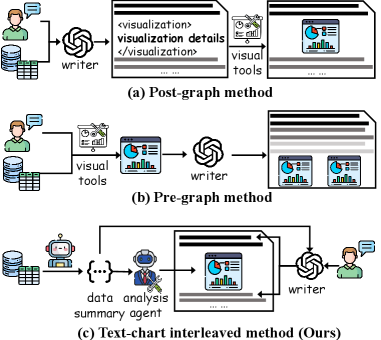
Fig 1: Figure 1: The illustration of different generation paradigms for text-chart interleaved report.
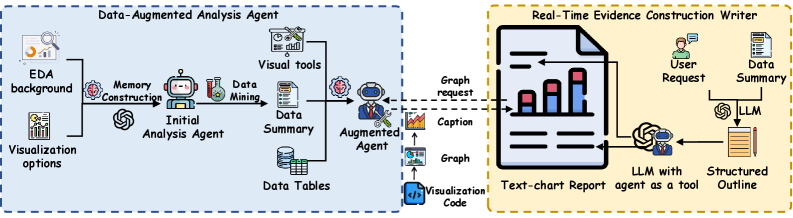
Fig 2: Figure 2: The Illustration of EvidFuse. Given a user analysis request and multiple data tables, EvidFuse first specializes a Data-Augmented Analysis Agent by EDA-derived dataset overview and raw tables. A Real-Time Evidence Construction Writer then plans an outline and generates the report. During generation, the writer suspends by specific visualization requests and continues when it receives visualization and request-based captions from the analysis agent as context for subsequent generation until <EOS> terminates the generation.
Ready to evaluate your AI agents?
Learn how ReputAgent helps teams build trustworthy AI through systematic evaluation.
Learn MoreLimitations
Method depends on multimodal language models plus a code-driven visualization tool, so compute and engineering complexity rise versus single-pass generation. Benchmarks cover 60 real reports but come from three public sources; results may differ on highly domain-specific or much larger datasets. The framework is training-free but still relies on the quality of generated code and captions, so failures in chart generation or caption grounding can still break alignment. A training-free framework provides guardrails for safer deployment.
Methodology & More
EvidFuse changes how automated data reports are built: instead of writing first or precomputing every chart, it uses two cooperating agents. A Data-Augmented Analysis Agent is primed with a dataset overview (built from 5–8 exploratory checks) and has access to the raw tables and a code-based visualization tool. A Real-Time Evidence Construction Writer drafts an outline and then generates the report, pausing wherever it needs a chart by issuing a visualization request. The analysis agent builds the requested visualization, returns an executable chart plus a grounded caption, and the writer resumes writing conditioned on that actual evidence.
Compared with single-pass generation, text-first-then-chart, or precomputed-chart-then-text pipelines, this interleaving keeps the evidence space dynamic rather than frozen. The team evaluated the approach on 60 reports from three public sources (Tableau Public, Our World in Data, USAFacts), judged across six quality criteria at chart, chapter, and report levels. Both an automated LLM judge and human raters preferred the interleaving approach on average, citing improved chart quality, stronger chart–text consistency, and deeper, decision-oriented insights. For practitioners, the pattern offers a practical way to make narratives that reliably match their visual evidence, at the cost of a more complex multi-agent runtime and reliance on robust code-based chart generation. LLM judge and code-based chart generation.
Test your agentsValidate against real scenarios
Credibility Assessment:
No affiliations given and low author h-indices; arXiv preprint with no citations.