Key Takeaway
Cache an agent’s internal reasoning steps (what to compute and how to render it) instead of only final answers — you can cut token use and model calls dramatically while keeping correctness.
ON THIS PAGE
Key Findings
Breaking analytic generation into two cacheable checkpoints — a normalized analytic intent and a visualization synthesis — recovers a lot of reuse that prompt-level caching misses. Visualization artifacts repeat heavily (so reusing them avoids expensive regeneration), while intent resolution is more fragile and needs entity-aware matching. Across a production marketing workload, this pipeline-aware caching yielded large token and call savings and raised effective cache hit rates versus a monolithic prompt→output cache. prompt-level caching misses
Data Highlights
178.4% reduction in projected tokens per user prompt (from ~59,906 to ~12,964) when caching both intent and visualization artifacts
283.11% exact-hit rate at the visualization synthesis checkpoint over 4,841 invocations, meaning most rendering work was reused
369.25% relative increase in overall cache hit rate versus a standard prompt→output caching baseline
What This Means
Platform engineers and teams building multi-step analytics or agent workflows — especially BI/dashboard products — will get faster responses and lower API costs without weakening correctness. Technical leaders evaluating deployment tradeoffs can use this pattern to reduce expensive model calls while preserving schema-sensitive checks. multi-step analytics
Not sure where to start?Get personalized recommendations
Key Figures
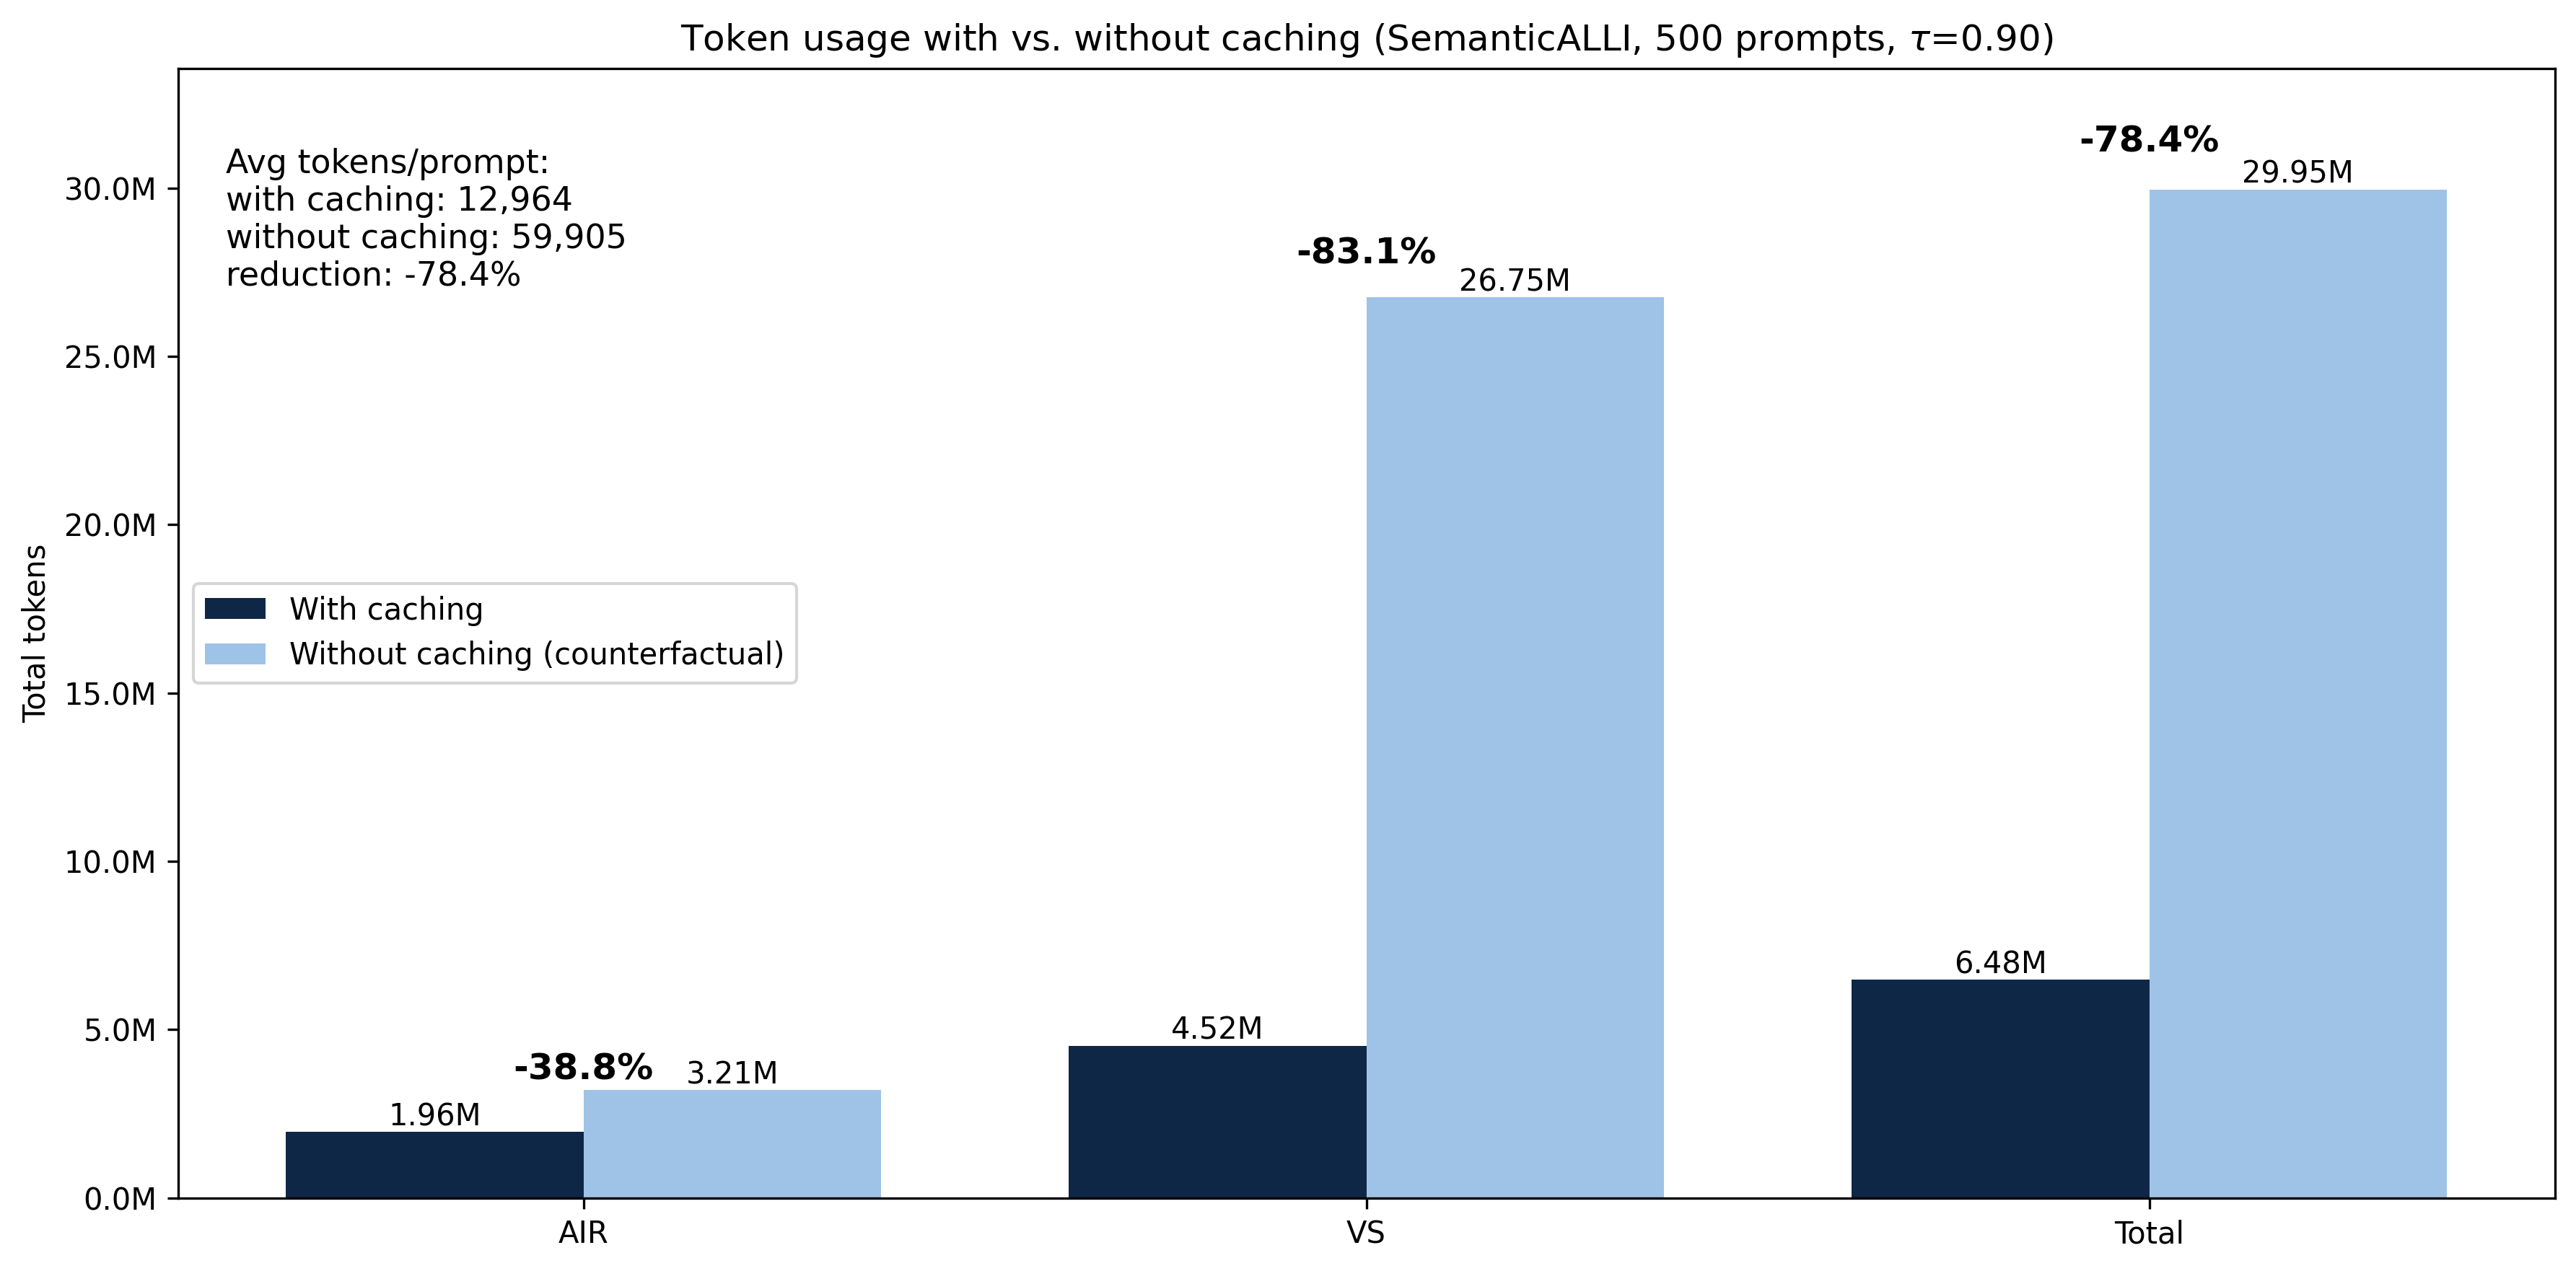
Fig 1: Figure 1: Projected token usage with SemanticALLI caching vs. without caching (500 prompts, τ = 0.90 \tau=0.90 ). “Without caching” is a counterfactual in which all AIR prompts and VS invocations are LLM-backed at baseline per-call token costs (AIR: 6,414.55 tokens/prompt; VS: 5,524.78 tokens/invocation). “With caching” uses the observed SemanticALLI costs (AIR: 3,925.71 tokens/prompt; VS: 933.54 tokens/invocation). The projection uses the observed rate of VS invocations per user prompt ( 4 , 841 / 500 ≈ 9.68 4{,}841/500\approx 9.68 ), yielding average tokens per user prompt of 59,906 without caching vs. 12,964 with caching (78.4% reduction). Percent labels denote token reduction relative to the counterfactual.
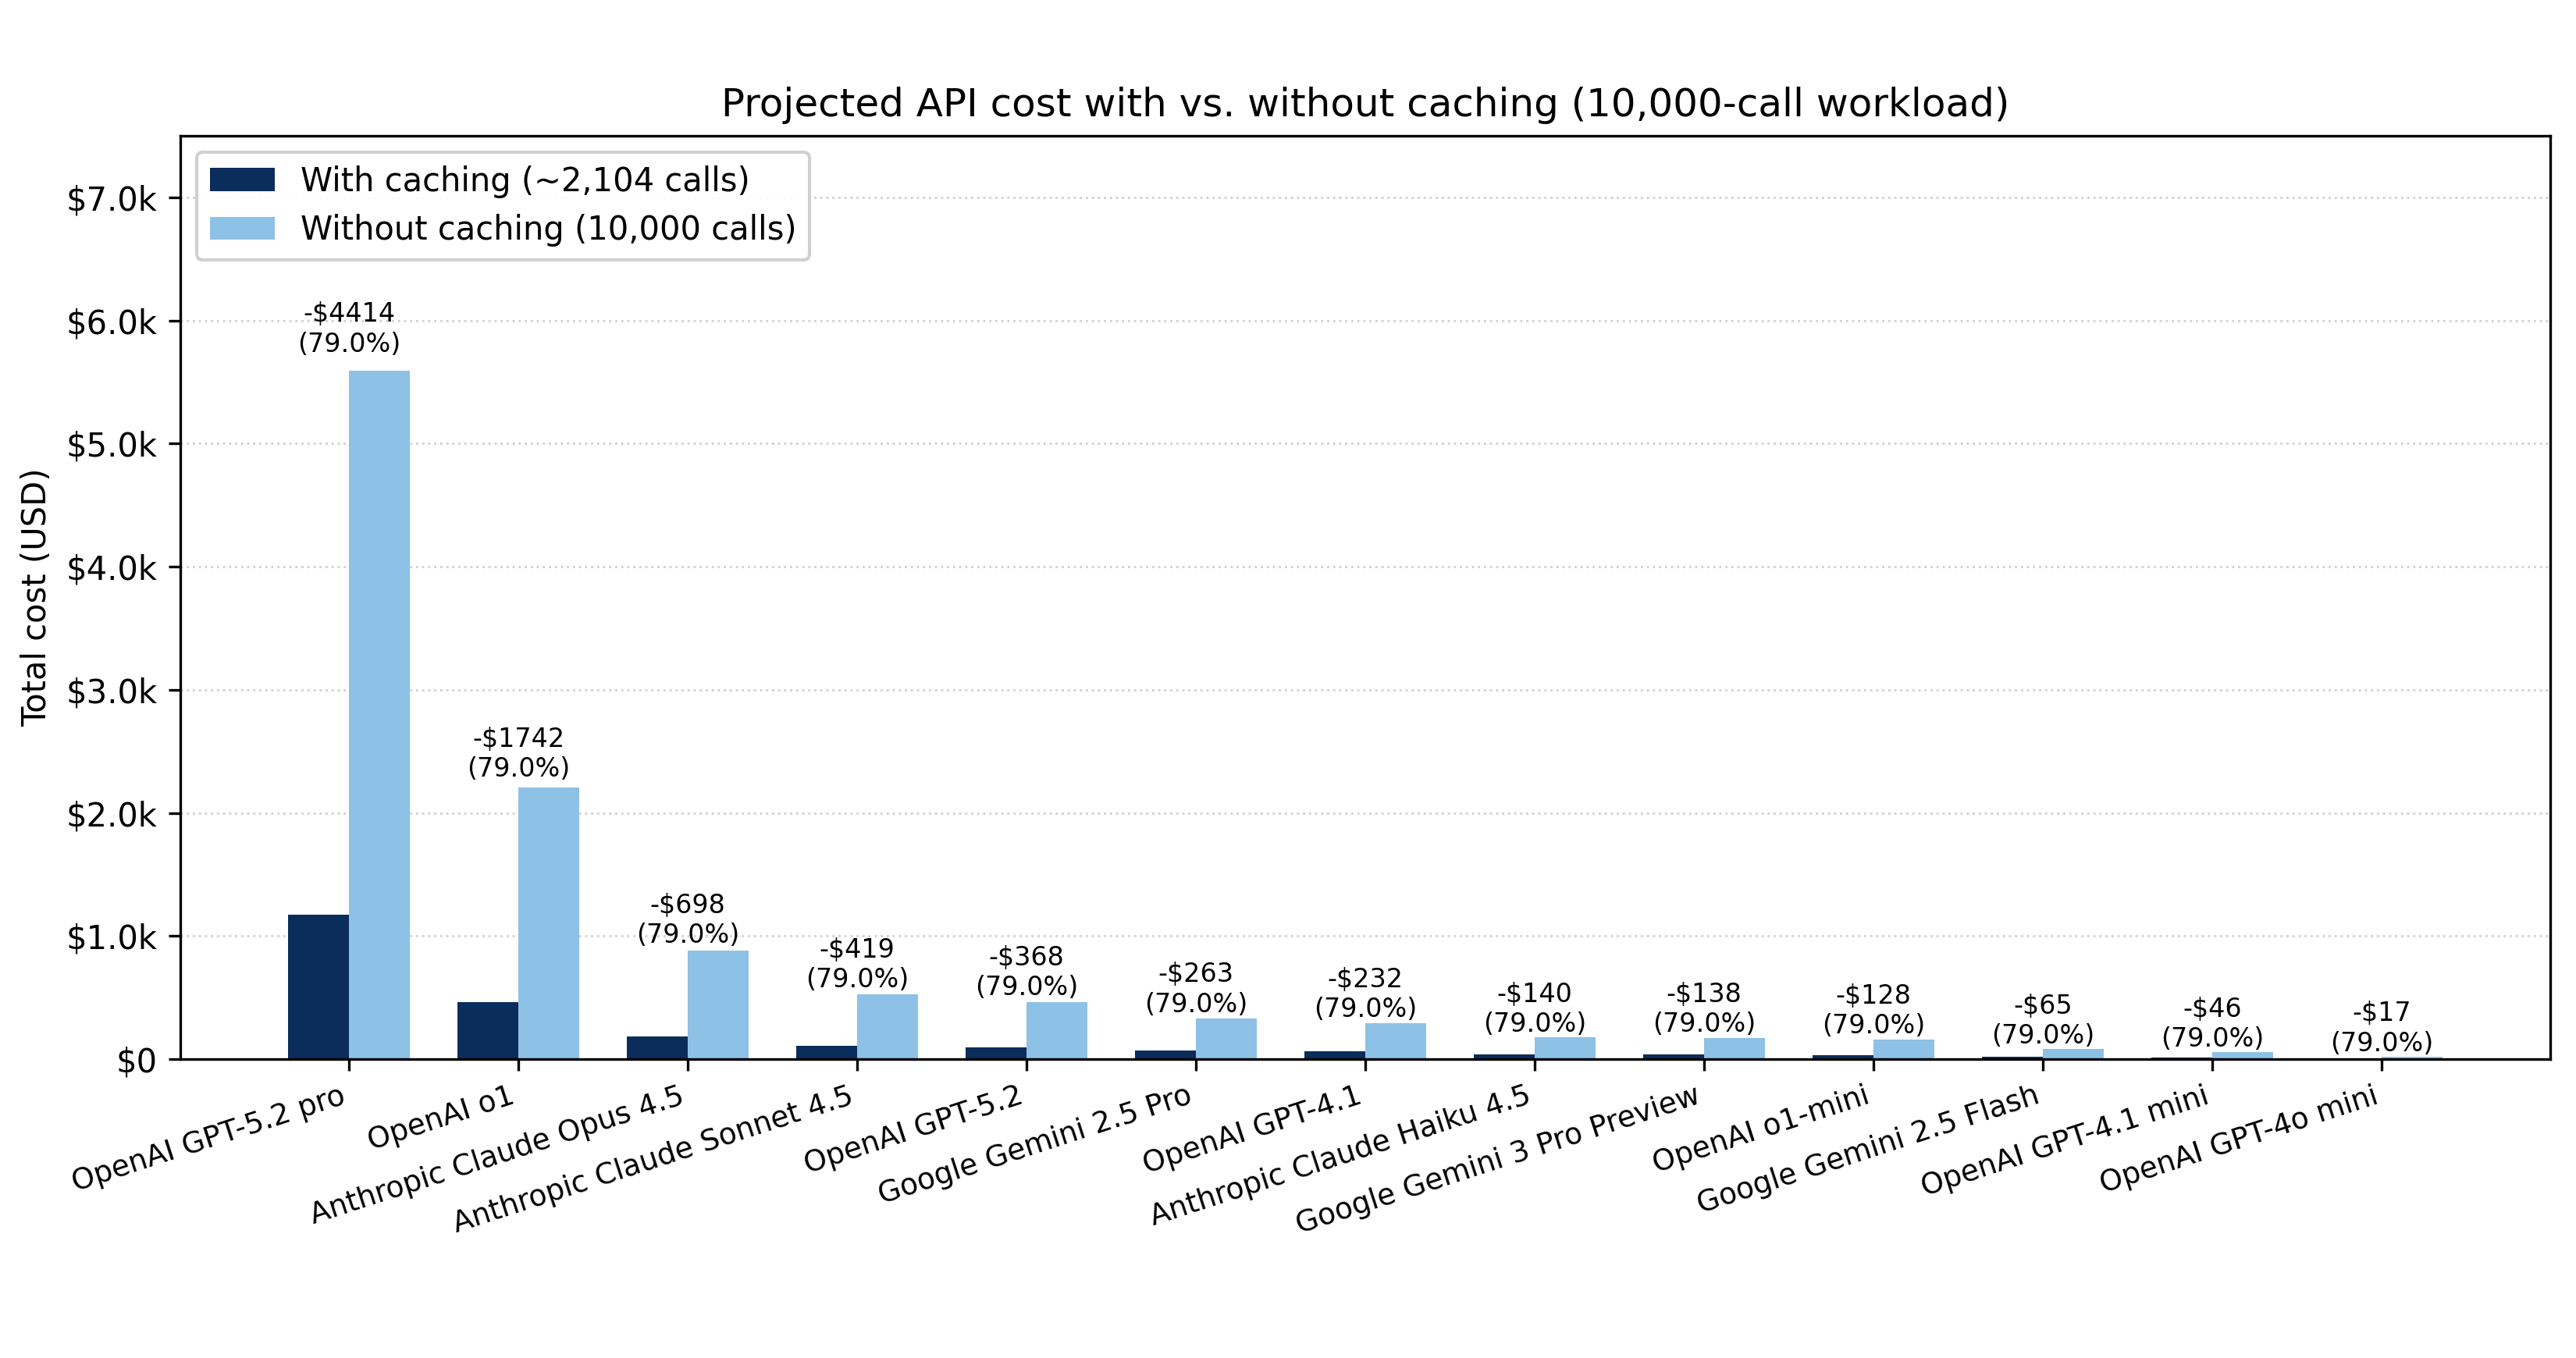
Fig 2: Figure 2: Projected API cost with VS caching vs. without caching per 10,000 calls. “With caching” assumes the measured call reduction at τ = 0.90 \tau=0.90 , retaining 21.04% of LLM-backed calls ( ≈ \approx 2,104 of 10,000). Costs are computed using per-token list pricing (input/output) and the observed mean token footprint per call (2,788 input tokens; 2,979 output tokens).
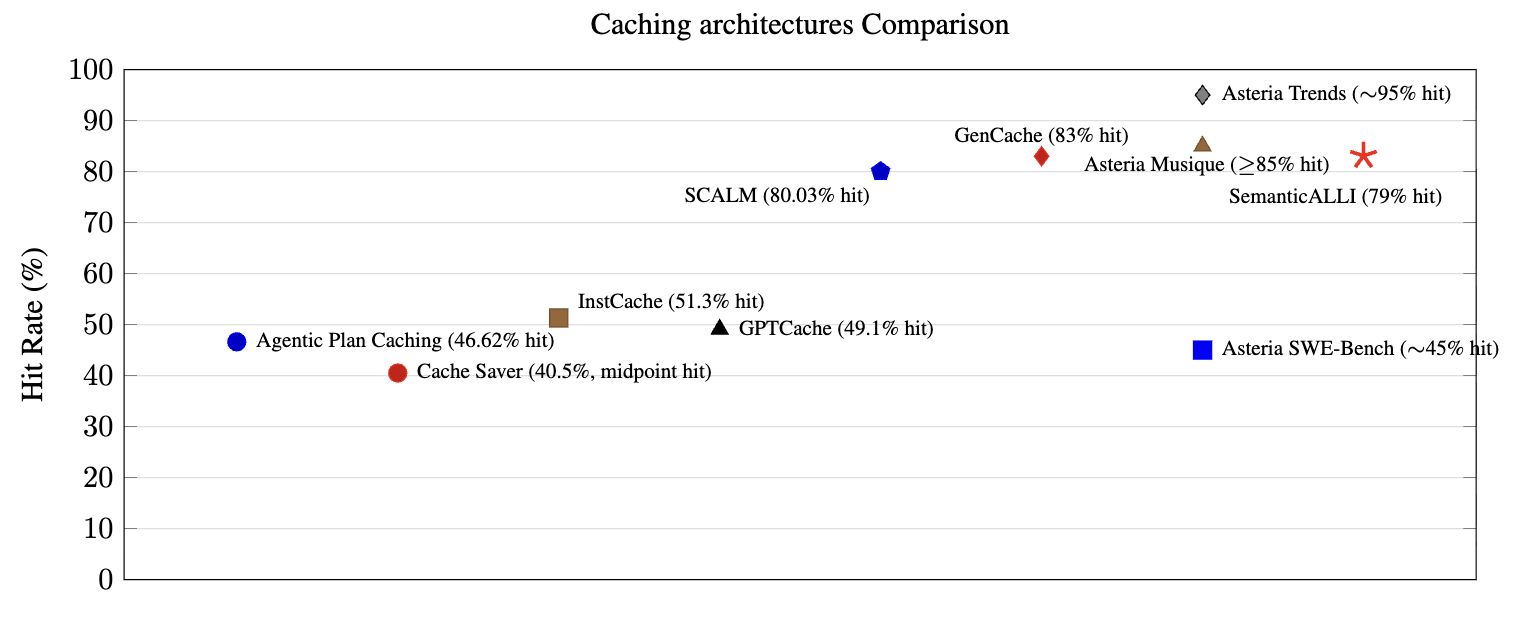
Fig 3: Figure 3: Hit rate comparison for discussed caching architectures. Cache Saver is shown at the midpoint of its reported 21–60% range. Asteria reports workload-specific hit rates, shown as three points. SemanticALLI is marked with a star.
Ready to evaluate your AI agents?
Learn how ReputAgent helps teams build trustworthy AI through systematic evaluation.
Learn MoreYes, But...
Results come from a proprietary, domain-specific marketing dataset, so reuse rates will vary by workload and phrasing. Intent-level caching is sensitive to single critical entities (e.g., metric names) and requires hybrid retrieval (semantic plus lexical) to avoid incorrect reuse. Cache staleness, invalidation, and cross-tenant safety require careful engineering before broad deployment. hybrid retrieval
Full Analysis
The system splits dashboard generation into two reusable checkpoints: Analytic Intent Resolution (a structured, schema-grounded description of metrics, dimensions, filters, and layout) and Visualization Synthesis (Visualization Synthesis chart and code artifacts). Instead of caching only the final natural-language output, cache these intermediate representations. Retrieval combines exact hashing with dense semantic search and lexical constraints so the system is permissive about wording but strict about critical entities like metric names. entity-aware matching Evaluation used 1,000 temporally ordered production prompts (500 seed, 500 challenge) from a digital media marketing workload and measured cache behavior at a strict similarity threshold. A monolithic prompt→output cache hit 38.7% at the threshold and missed most requests. In contrast, SemanticALLI showed heavy reuse downstream: visualization artifacts hit 83.11% and drove a 78.4% drop in projected token usage per prompt. The approach raises effective hit rates and cuts model-backed calls (example projection retained ~21% of LLM calls for a 10,000-call baseline), but intent caching remains harder and demands entity-aware matching and careful thresholding to avoid wrong reuse. Overall, adopting pipeline-aware caching narrows the gap between powerful but slow reasoning and the responsiveness users expect, while trading some engineering complexity around retrieval, invalidation, and tenant safety.
Explore evaluation patternsSee how to apply these findings
Credibility Assessment:
Large author list but no recognizable top institutions or high h-index signals; arXiv preprint.